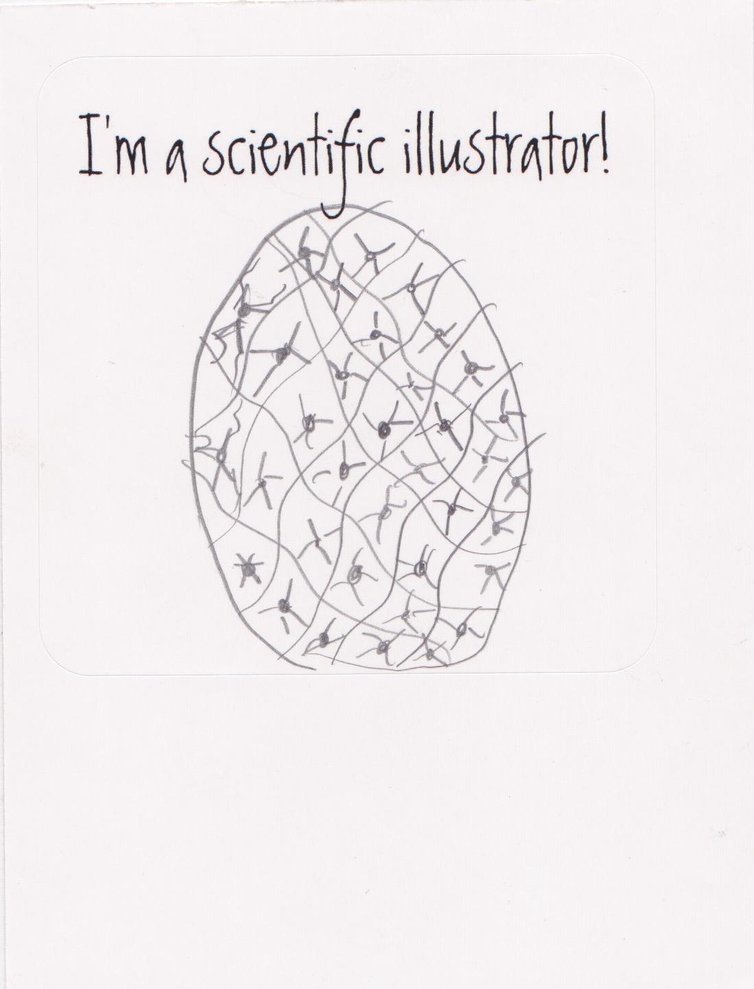
| Dear Friends, I have a story and some resources to share to celebrate the publication of Storytelling to Accelerate Climate Solutions, especially the chapter about visual science communication. I had the opportunity to work alongside and learn from visual science communicators Kalliopi Monoyios, Kirsten Carlson, Taina Litwak, and Fiona Martin. We collaborated on the chapter, Visuals as a Catalyst for Climate Science Communication. This chapter provides a historical overview of scientific illustration and what visual science communication looks like in formal and informal learning environments. I share this chapter here in case this topic is of interest. Published by Springer Nature, this chapter and the entire book are open-access and available for free. Today’s story is about a Fibonacci-themed booth I created for the ideal Pi Day event. What made this the quintessential Pi Day event is that the date, March 14, 2015, matched the first five digits in Pi (3.1415). To make this day even more special, the STEM and career festival for students and families I participated in began at 9:52 AM (9-5-2 are the next three digits in Pi). Event organizers and exhibitors happily celebrated Pi Day by playing up 3.1415952. Science, technology, engineering, and mathematics were well-represented on this day. Participating exhibitors were asked to include a career component with their planned exhibit. The tabletop activity I created for this event focused on the Fibonacci spiral. Visitors learned to identify Fibonacci spirals on pine cones, pineapples, and artichokes. The career I chose to highlight on this day was scientific illustration. During my activity, students learned how to see Fibonacci spirals and how knowing about these spirals helps scientific illustrators capture the patterns on objects where the spiral is observed. Instead of handing out sheets of paper, I gave each student a large sticker with “I’m a scientific illustrator!” printed across the top. Students attached the stickers to their shirts before moving on to the next booth. It was fun to see them visualize Fibonacci spirals on their stickers and then wear their illustrations (and new identity) around the festival. |
| I share this story because it is a good example of how, through drawing, so much can be seen and understood. To learn more about visual science communication, I encourage you to see Chapter 11 in Storytelling to Accelerate Climate Solutions. You will learn so much from Kalliopi Monoyios, Kirsten Carlson, Taina Litwak, and Fiona Martin. You can learn more about the history of Pi Day and how it became a national U.S. holiday here. |
Before I go, allow me to share two additional resources with you.
| The first resource is something I created for teachers in 2017. It is a single sheet of paper upon which you’ll find background information that will help you introduce the importance of seeing plants and set the stage for botanical drawing activities. This handout links to articles from this site. I’ve updated as many links as possible. Download Seeing Plants w/Sci-Art (PreK – Adult) Now for that second resource… While checking the links on the Seeing Plants handout, I came across a new paper about sketching plants. This paper by researcher Joonhyun Kim scientifically validates some of what has always been accepted — that drawing changes our emotional connection to the natural world. What else did he find out? Click here to download A Study on the Plant Sketching Practice for the Enhancement of People’s Intention for Pro-Environmental Behavior. This paper is available for free. |


